Tuesday, October 21, 2014

NIFTY FUTURES UPDATES (OCT 21)


Nifty Futures, yesterday made a GAP UP opening, registered a 
high of  7932, slides upto 7882 and managed to close @ 7893


Today, if trades  below  7908 for 15 minutes see an intraday slide 
upto 7870-53-35

Suppose if cuts 7909 & trades above the level for 15 minutes,

See a sure hike upto 7930-45


INTRADAY RESISTANCES @   7910 – 31 – 46

INTRADAY SUPPORTS       @   7869-52 36


Now ‘a million dollar’ question before traders is


‘Which GAP is going to be filled at first?

A GAP DOWN formed on OCT 10 @ 7984
Or
THE GAP UP formed yesterday (OCT 20) @ 7814


Pls trade carefully with the mentioned time and levels


ALL THE BEST


 (By the time this post was updated S&P CNX Nifty Futures was 
trading @ 7919 )


இன்றைய சந்தை அடிப்படை (OCT 21)

இந்திய நேரப்படி இன்று காலை 6:00 மணிக்கு வெளியாகும் (ஆஸ்திரேலிய 
டாலரை பாதிக்கவல்ல) Monetary Policy Meeting Minutes மற்றும் சீன காலாண்டு GDP 
(YoY & QoQ ) அறிக்கைகள், வருடாந்திர தொழிற்சாலை உற்பத்தி போன்ற 
தகவல்கள் சந்தையின் தொடக்கத்தில் பாதிப்பைக் கொண்டு வருமென 
தெரிகிறது!


தொடர்ந்து மாலை 7:30 மணிக்கு அமெரிக்க டாலர் குறியீட்டை நேரடியாக 
பாதிக்கவல்ல தகவல்களான (செப்டம்பர் மற்றும் மாதாந்திர) கையிருப்பு வீட்டு 
விற்பனை விவரங்கள்  இன்று சந்தையில் முக்கியத்துவம் வாய்ந்ததாகக் 
கருதப்படுகிறது!

இன்று தங்கம், கச்சாஎண்ணெய், இயற்கை எரிவாயு,

வெள்ளி மற்றும் காப்பர் அதில் கவனமாக செயல்படவேண்டிய நேரம்

10:00 10:45 PM; 7:15 8:00 PM


வெல்க!


DISCLAIMER 
THE RECOMMENDATIONS MADE HERE DO NOT CONSTITUTE AND OFFER TO SELL OF A SOLICITATION TO BUY ANY OF THE SECURITIES/COMMODITIES OF ANY OTHER INSTRUMENTS WHATSOEVER MENTIONED. NO REPRESENTATIONS CAN BE MADE THAT THE RECOMMENDATIONS CONTAINED WILL BE PROFITABLE OF THAT THEY WILL NOT RESULT IN LOSSES. READERS USING THE INFORMATION CONTAINED HEREIN ARE SOLELY RESPONSIBLE FOR THEIR ACTIONS. SURFING OR USING ‘tradersharmony.blogspot.com' DEEMS THAT THE SURFER ACCEPTS AND ACKNOWLEDGES THE DISCLAIMERS AND DISCLOSURES.THE INFORMATION PUBLISHED ARE FOR EDUCATIONAL AND INFORMATIVE PURPOSE ONLY AND THE USER/READERS SHOULD TAKE ADVICE OF HIS/HER ADVISER BEFORE TAKING ANY DECISION FOR BUYING, SELLING OR OTHERWISE DEALING WITH SECURITIES/COMMODITIES OR ANY OTHER INSTRUMENT WHATSOEVER.



Monday, October 20, 2014

HAVE A MARVELOUS MONDAY


A Day in the Life of the Momentum Trader

A good way to illustrate momentum trading is to look at a typical day of a momentum trader: 

He gets up an hour before the market opens, switches on his computer, goes online and immediately logs into one of the popular trading chat rooms or message boards.

When looking at these boards, our hero focuses on stocks that are generating a significant amount of buzz. He looks at stocks that are the focus of trading alerts based on earnings or analyst recommendations. These are stocks rumored to be in play, and they are anticipated to provide the most significant price movements on high volume for that trading day.

While surfing the web, he will also turn on CNBC and listen for mentions of companies releasing news or positioned to undergo significant movement.

He eyes the morning equity options pages to find stocks with significant volume increases in calls. Any increase in calls written indicates that a price increase or decrease above or below the option premium is expected.

Once the market opens, he watches his initial list of stocks in relation to the rest of the market: Are his stocks going up when the market goes down? Are they significantly increasing in price in relation to the rest of the market? Are they behaving consistently with his expectations based on his pre-market assessment?

He will then narrow his watch list to include only the strongest stocks: those increasing more rapidly on higher volume than the rest of the market, stocks trading contrary to the market and stocks with movements clearly propelled by external factors.

Analyzing the Charts
Next, a momentum trader will analyze the list of stocks he has chosen to focus on by examining their charts. The primary technical indicator of interest is the momentum indicator - the accumulated net change of a stock's closing/ending price over a series of defined time periods. The momentum line is plotted as a tandem line to the price chart, and it displays a zero axis, with positive values indicating a sustained upward movement and negative values indicating a potentially sustained downward movement.

That upward or downward momentum indicator often immediately portrays a breakout for the stock, which means that even a period or two of sustained momentum will propel that stock in the direction of the breakout. While watching the momentum chart, he has his Level 2 screen up, looking for evidence of a push, where bids start to line up (indicated by the presence of market-maker limit orders) and offers start to disappear.

When the trader believes he has identified a breakout, he does not necessarily need to jump immediately into the stock. He is not generally worried about missing the first one or two breakout ticks, but he has his hand on the buy trigger (or sell trigger in the case of a short sale, but a short sale must be done on an uptick) for one of the next momentum periods. And he is generally not too concerned about hitting the bid either, as he will have an easier time getting in at the market price. Then he places a market order.

Momentum Trader: In Position
Once he has entered into his position, the white-knuckle ride and nail-biting begins. Will the stock continue to move strongly in the direction of his momentum line? Or will it immediately change course, proving the momentum chart wrong and perhaps pointing to a trap set by the market maker? Or will the breakout fizzle quickly, providing some limited upside but not enough profit to make the trade worthwhile?


Whether the momentum fizzles almost immediately or continues to build, the trader remains glued to his screen. He is looking for a saturation point, where orders start piling up on the offer and bidding slows or thins at the market price a few levels back on the Level 2 screen. The saturation point does not mean an immediate end to the momentum, but it may signal that the top is near. So the trader sells his position (or covers his position in the case of a short sale) and takes his profits to pack it in for the day or to move on to the next stock on his list.


NIFTY FUTURES UPDATES (OCT 20)


Nifty Futures, on Friday after having traded above the level of 7780 for 20 minutes, zoomed as predicted exactly upto 7843 and much more than that and managed to close @ 7814


Today if cuts and trades  below  7813 for 15 minutes see an intraday slide upto 7792-82

Suppose if cuts  7838 & trades above the level for 20 minutes,
See a rocket hike upto 7860-80 & 7900

INTRADAY RESISTANCES @   7862 82 & 7902
INTRADAY SUPPORTS   @   7790 80

Trade carefully with the time and levels
Beware of the GAP (DOWN) formed on OCT 10 yet to be filled upto 7984

ALL THE BEST


DISCLAIMER 
THE RECOMMENDATIONS MADE HERE DO NOT CONSTITUTE AND OFFER TO SELL OF A SOLICITATION TO BUY ANY OF THE SECURITIES/COMMODITIES OF ANY OTHER INSTRUMENTS WHATSOEVER MENTIONED. NO REPRESENTATIONS CAN BE MADE THAT THE RECOMMENDATIONS CONTAINED WILL BE PROFITABLE OF THAT THEY WILL NOT RESULT IN LOSSES. READERS USING THE INFORMATION CONTAINED HEREIN ARE SOLELY RESPONSIBLE FOR THEIR ACTIONS. SURFING OR USING ‘tradersharmony.blogspot.com' DEEMS THAT THE SURFER ACCEPTS AND ACKNOWLEDGES THE DISCLAIMERS AND DISCLOSURES.THE INFORMATION PUBLISHED ARE FOR EDUCATIONAL AND INFORMATIVE PURPOSE ONLY AND THE USER/READERS SHOULD TAKE ADVICE OF HIS/HER ADVISER BEFORE TAKING ANY DECISION FOR BUYING, SELLING OR OTHERWISE DEALING WITH SECURITIES/COMMODITIES OR ANY OTHER INSTRUMENT WHATSOEVER.


Sunday, October 19, 2014

WEEKLY REPORT FROM SHAREKHAN

Indices witness marginal losses in the truncated week
Indian stock markets fell nearly 1% in the holiday shortened week led by mixed cues in the domestic and global markets

Major Headlines for the week:
  • WPI inflation for September 2014 declines to 2.38%
  • Reliance Industries: first cut analysis of Q2FY2015 result
  • TCS tanks 8% as September quarter misses expectations
  • Axis Bank Q2 In-Line with estimates
Indian indices: 

Welcome to the 'Weekly Market Wrap' for October 17, 2014 where key benchmark indices declined on sustained selling by foreign funds. However, a steady decline in crude oil prices cushioned steep slide.

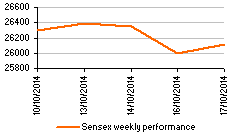
The barometer index, the S&P BSE Sensex, regained the psychological 26,000 mark after declining below that level during the week. In the truncated trading week, key indices logged gains in two trading sessions and declined in other two trading sessions. Indian stocks registered declines for fourth straight week in the week ended Friday, 17 October 2014.

In the week ended Friday, 17 October 2014, the 30-share S&P BSE Sensex fell 188.90 points or 0.71% to settle at 26,108.53. The 50-unit CNX Nifty points declined 80.30 points or 1.02% to settle at 7,779.70.

The S&P BSE Mid-Cap index fell 171.90 points or 1.82% to settle at 9,272.49. The S&P BSE Small-Cap index declined 297 points or 2.79% to settle at 10,313.97. Both these indices underperformed the Sensex.

Weekly market trend from October 13 - October 17

October 13: Indian shares gained on Monday, as stocks of blue-chip companies recovered from recent losses, tracking positive cues from the European markets, while technology shares rose for a second day. The BSE Sensex and the CNX Nifty ended 0.33%-0.31% higher. The 30-share Sensex ended up 86 points at 26,384 and the 50-share Nifty ended up 24 points at 7,884.

October 14: Indian shares edged down on Tuesday as DLF plunged after the market regulator banned it from tapping capital markets, although broader losses were capped as Reliance Industries gained after better-than-expected earnings and lenders rose on easing inflation. The BSE Sensex and the CNX Nifty ended 0.13%-0.26% lower.

October 15: Indian markets were closed on Wednesday due to assembly elections in the western Maharashtra state.

October 16: Indian shares fell for a second consecutive session on Thursday as companies seen most exposed to the global economy such as Hindalco Industries and Sesa Sterlite declined tracking a downturn in global markets. The 30-share Sensex ended down 349.99 points at 25999 and the 50-share Nifty fell by 115.80 points at 7748.20.

October 17: Indian shares rose on Friday, led by gains in stocks of domestic oriented companies including lenders such as HDFC Bank on value buying and hopes a likely win for the BJP in two recent state elections would help push key reforms. The 30-share Sensex ended up 109 points at 26,109 and the 50-share Nifty closed 32 points up at 7,780.

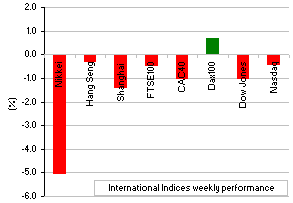
Global indices:
Top Gainers: DAX 100 up 0.70%
Top Losers: Nikkei down 5.02%, Shanghai Composite down 1.40% and CAC 40 down 0.99%.

Sectoral and stock screening:
Top Gainers: S&P BSE Bankex up 3.09% and S&P BSE PSU up 0.98%


Top Loser: S&P BSE Realty down 10.2%, S&P BSE IT down 5.15% and S&P BSE TECk down 3.94%.


Looking at the 'A' group stocks, the top three gainers of the week were - Den Networks up by 20.51%, BF Utilities up by 17.71% and Sintex Industries up by 12.33%.

Top three losers of the week were - DLF down by 27.34%, CMC down by 16.10% and Rallis India down by 15.2%.

FII/MF activity:
The foreign institutional investors (FIIs) have been the net sellers of the Indian stocks to the tune of Rs2318.18 crore while the domestic investors bought Indian shares worth a net of Rs1259 crore as on October 16, 2014.

TOP MOVERS (GROUP A) 
CompanyPrice (Rs)% chg
Gainers
Den Network
180.40
20.51
BF Utilities
643.90
17.71
Sintex Industries
81.55
12.33
Losers
DLF
110.70
-27.34
CMC
1,872.65
-16.10
Rallis India
212.00
-15.20
 
 FII/MF ACTIVITIES
Rs (cr)
FII
MF
Gross purchase9,656.033,015.30
Gross sale
11,974.83
1,756.30
Net investment
-2,318.80
1,259.00
*Data as on October 16, 2014
Market Outlook for the coming week!  
In the coming week, trend in global markets, Q2 results of India Inc., results of assembly elections in Maharashtra and Haryana, investment by foreign portfolio investors (FPIs), the movement of rupee against the dollar and crude oil price movement will dictate term trend on the bourses in the forthcoming truncated trading week.

Stock market remains closed on Thursday, 23 October 2014 on account of Diwali Laxmi Pujan and again on Friday, 24 October 2014 on account of Diwali Balipratipada. However, the stock exchanges will conduct a special live trading session on Thursday, 23 October 2014, on account of Muhurat trading on Diwali. Trading will begin at 18:30 IST and will conclude on 19:30 IST on that day.

Results of the assembly elections in Maharashtra and Haryana will be announced on Sunday, 19 October 2014.

Various exit polls released after assemble elections held on 15 October 2014 showed that the BJP is set to wrest power from the Congress party in Haryana and will emerge as the single largest party in Maharashtra. BJP's strong showing in assembly elections in Maharashtra and Haryana could boost Prime Minister Narendra Modi's ability to carry forward legislative reforms.

Among global economic data, China will publish third quarter GDP data on Tuesday, 21 October 2014. HSBC and Markit will announce a preliminary reading of their China manufacturing purchasing managers' index for October on Thursday, 23 October 2014. On the same day, Markit Flash Eurozone Composite PMI will be released. Focus will also be on Fourth Plenum, an annual meeting of China leaders which may offer clues about plans to address a slowing economy, to be held from October 20-23.

The Federal Open Market Committee (FOMC) next undertakes a monetary policy review at a two-day meeting on 28-29 October 2014