
Friday, January 02, 2015


HAVE A GREAT WEEK END


ANALYZING CHART PATTERNS: GAPS
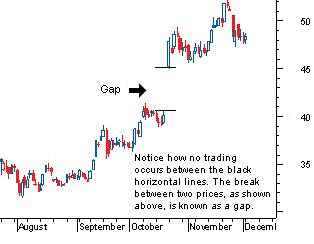
A gap in a chart is essentially an empty space between
one trading period and the previous trading period. They usually form because
of an important and material event that affects the security, such as an
earnings surprise or a merger agreement.
This happens when there is a large-enough difference in
the opening price of a trading period where that price and the subsequent price
moves do not fall within the range of the previous trading period. For example,
if the price of a company's stock is trading near Rs40 and the next trading
period opens at Rs45, there would be a large gap up on the chart between these
two periods, as shown by the figure below.
Gap price movements can be found on bar charts and
candlestick charts but will not be found on point-and-figure or basic line
charts. The reason for this is that every point on both point-and-figure charts
and line charts are connected.
It is often said when referring to gaps that they will
always fill, meaning that the price will move back and cover at least the empty
trading range. However, before you enter a trade that profits the covering,
note that this doesn't always happen and can often take some time to fill.
There are four main types of gaps: common, breakaway,
runaway (measuring), and exhaustion. Each are the same in structure, differing
only in their location in the trend and subsequent meaning for chartists.
Common Gap
As its name implies, the common gap occurs often in the
price movements of a security. For this reason, it's not as important as the
other gap movements but is still worth noting.
Common Gap

These types of gaps often occur when a security is
trading in a range and will often be small in terms of the gap's price
movement. They can be a result of commonly occurring events, such as low-volume
trading days or after an announcement of a stock split.
These gaps often fill quickly, moving back to the
pre-gap price range.
(to be contd)
NIFTY FUTURES UPDATE & TODAY'S FUNDAMENTALS (JAN 02)

Today Nifty finding its resistance @ 8357
If trades above 8357 for 30 minutes
it reaches 8380-95
Suppose if opened and trades below 8341 for 30 minutes
see a sure slide upto 8325
And below this level for 30 minutes, it slides more upto 8310-8300
INTRADAY RESISTANCES @ 8359-81-96
INTRADAY SUPPORTS @ 8325-8300
Trade very carefully with
the above mentioned time and levels.
ALL THE VERY
BEST
(By the time this post was updated
S&P CNX Nifty
Futures was trading @ 8342)
இன்றைய சந்தை அடிப்படை (JAN 02)
இந்தியநேரப்படி இன்று
காலை
7:15 மணிக்கு சீன நாணயத்தை பாதிக்கும்படி வெளியாகும் டிசம்பர் மாதத்து HSBC
Manufacturing PMI தகவல் இந்திய சந்தையின் ஆரம்பத்தில் சிறு தாக்கத்தைக்
கொடுக்கும்!
முற்பகல் 10:30’க்கு வெளியாகும் HSBC
Markit Manufacturing PMI,
மாலை 5:00 மணிக்கு வெளியாகும் ‘டாலர் கையிருப்பு’ போன்ற தகவல்கள்
டாலருக்கு எதிரான இந்திய ரூபாயையும்;
பிற்பகல் 2:25’க்கு வெளியாகும்
German Manufacturing PMI மற்றும் 2:58’க்கு வெளியாகும்
Manufacturing PMI டாலருக்கு எதிரான யூரோவையும் பாதிக்கவல்லது!
இரவு 8:30 மணிக்கு வெளியாகும் அமெரிக்காவின் ISM
Manufacturing PMI தகவல் டாலர் குறியீட்டை நேரடியாக பாதிக்குமெனத் தெரிகிறது!
ஆக இன்று கச்சா எண்ணெய், தங்கம், வெள்ளி, காப்பர், நிக்கல்
மற்றும் இயற்கை எரிவாயு (Natural Gas) போன்ற கமாடிட்டிகளிலும் கவனமாக இருக்க வேண்டிய நேரம்...
10:00 – 11 AM; 2:15- 3:20
PM; 8:25
– 9:30 PM
வெல்க அன்பு நெஞ்சங்களே!
DISCLAIMER
THE RECOMMENDATIONS MADE HERE DO NOT CONSTITUTE AND OFFER TO SELL OF A SOLICITATION TO BUY ANY OF THE SECURITIES/COMMODITIES OF ANY OTHER INSTRUMENTS WHATSOEVER MENTIONED. NO REPRESENTATIONS CAN BE MADE THAT THE RECOMMENDATIONS CONTAINED WILL BE PROFITABLE OF THAT THEY WILL NOT RESULT IN LOSSES. READERS USING THE INFORMATION CONTAINED HEREIN ARE SOLELY RESPONSIBLE FOR THEIR ACTIONS. SURFING OR USING ‘tradersharmony.blogspot.com' DEEMS THAT THE SURFER ACCEPTS AND ACKNOWLEDGES THE DISCLAIMERS AND DISCLOSURES.THE INFORMATION PUBLISHED ARE FOR EDUCATIONAL AND INFORMATIVE PURPOSE ONLY AND THE USER/READERS SHOULD TAKE ADVICE OF HIS/HER ADVISER BEFORE TAKING ANY DECISION FOR BUYING, SELLING OR OTHERWISE DEALING WITH SECURITIES/COMMODITIES OR ANY OTHER INSTRUMENT WHATSOEVER.
Wednesday, December 31, 2014
HAVE A GREAT WEDNESDAY

ANALYZING CHART PATTERNS: THE WEDGE
The wedge chart pattern signals a reverse of the trend
that is currently formed within the wedge itself. Wedges are similar in
construction to a symmetrical triangle in that there are two trendlines -
support and resistance - which band the price of a security.
The wedge pattern differs in that it is generally a
longer-term pattern, usually lasting three to six months. It also has
converging trendlines that slant in an either upward or downward direction,
which differs from the more uniform trendlines of triangles.
There are two main types of wedges – falling and rising
– which differ on the overall slant of the pattern. A falling wedge slopes
downward, while a rising wedge slants upward.
Falling Wedge
The falling wedge is a generally bullish pattern
signaling that one will likely see the price break upwards through the wedge
and move into an uptrend. The trendlines of this pattern converge, with both
being slanted in a downward direction as the price is trading in a downtrend.
Falling wedge pattern

From the above, one can see that a wedge is similar to
the triangles, in that the price movement bounces between the two trendlines,
which are bounding the price movement.
Another thing to look at in the falling wedge is that
the upper (or resistance) trendline should have a sharper slope than the
support level in the wedge construction. When the lower (or support) trendline
is clearly flatter as the pattern forms, it signals that selling pressure is
waning, as sellers have trouble pushing the price down further each time the
security is under pressure.
The price movement in the wedge should at minimum test
both the support trendline and the resistance trendline twice during the life
of the wedge. The more times it tests each level, especially on the resistance
end, the higher quality the wedge pattern is thought to be.
The buy signal is formed when the price breaks through
the upper resistance line. This breakout move should be on heavier volume, but
due to the longer-term nature of this pattern, it's important that the price
has successive closes above the resistance line.
Rising Wedge
Conversely, a rising wedge is a bearish pattern that
signals that the security is likely to head in a downward direction. The
trendlines of this pattern converge, with both trendlines slanted in an upward
direction.
Rising wedge pattern

Again, the price movement is bounded by the two
converging trendlines. As the price moves towards the apex of the pattern,
momentum is weakening. A move below the lower support would be viewed by
traders as a reversal in the upward trend.
As the strength of the buyers weakens (exhibited by
their inability to take the price higher), the sellers start to gain momentum.
The pattern is complete, with the sellers taking control of the security, when
the price falls below the supporting trendline.
Subscribe to:
Posts (Atom)